
Year
2022
Stack
Python(Data Analysis)
Figma(UI & UX Design)
Role
Ideation and reasearch
Data Expert
AI system core define
Prototype
Industries
Travel Agency
Museum
Project Collaborators
5 group members
Key Shots
To empower the British Museum's management with AI-driven insights for strategic decision-making. This project was conceived to navigate the challenges posed by the COVID-19 pandemic, enhancing operational and planning through predictive analytics on visitor flows, social network engagement opportunities, and financial forecasts.
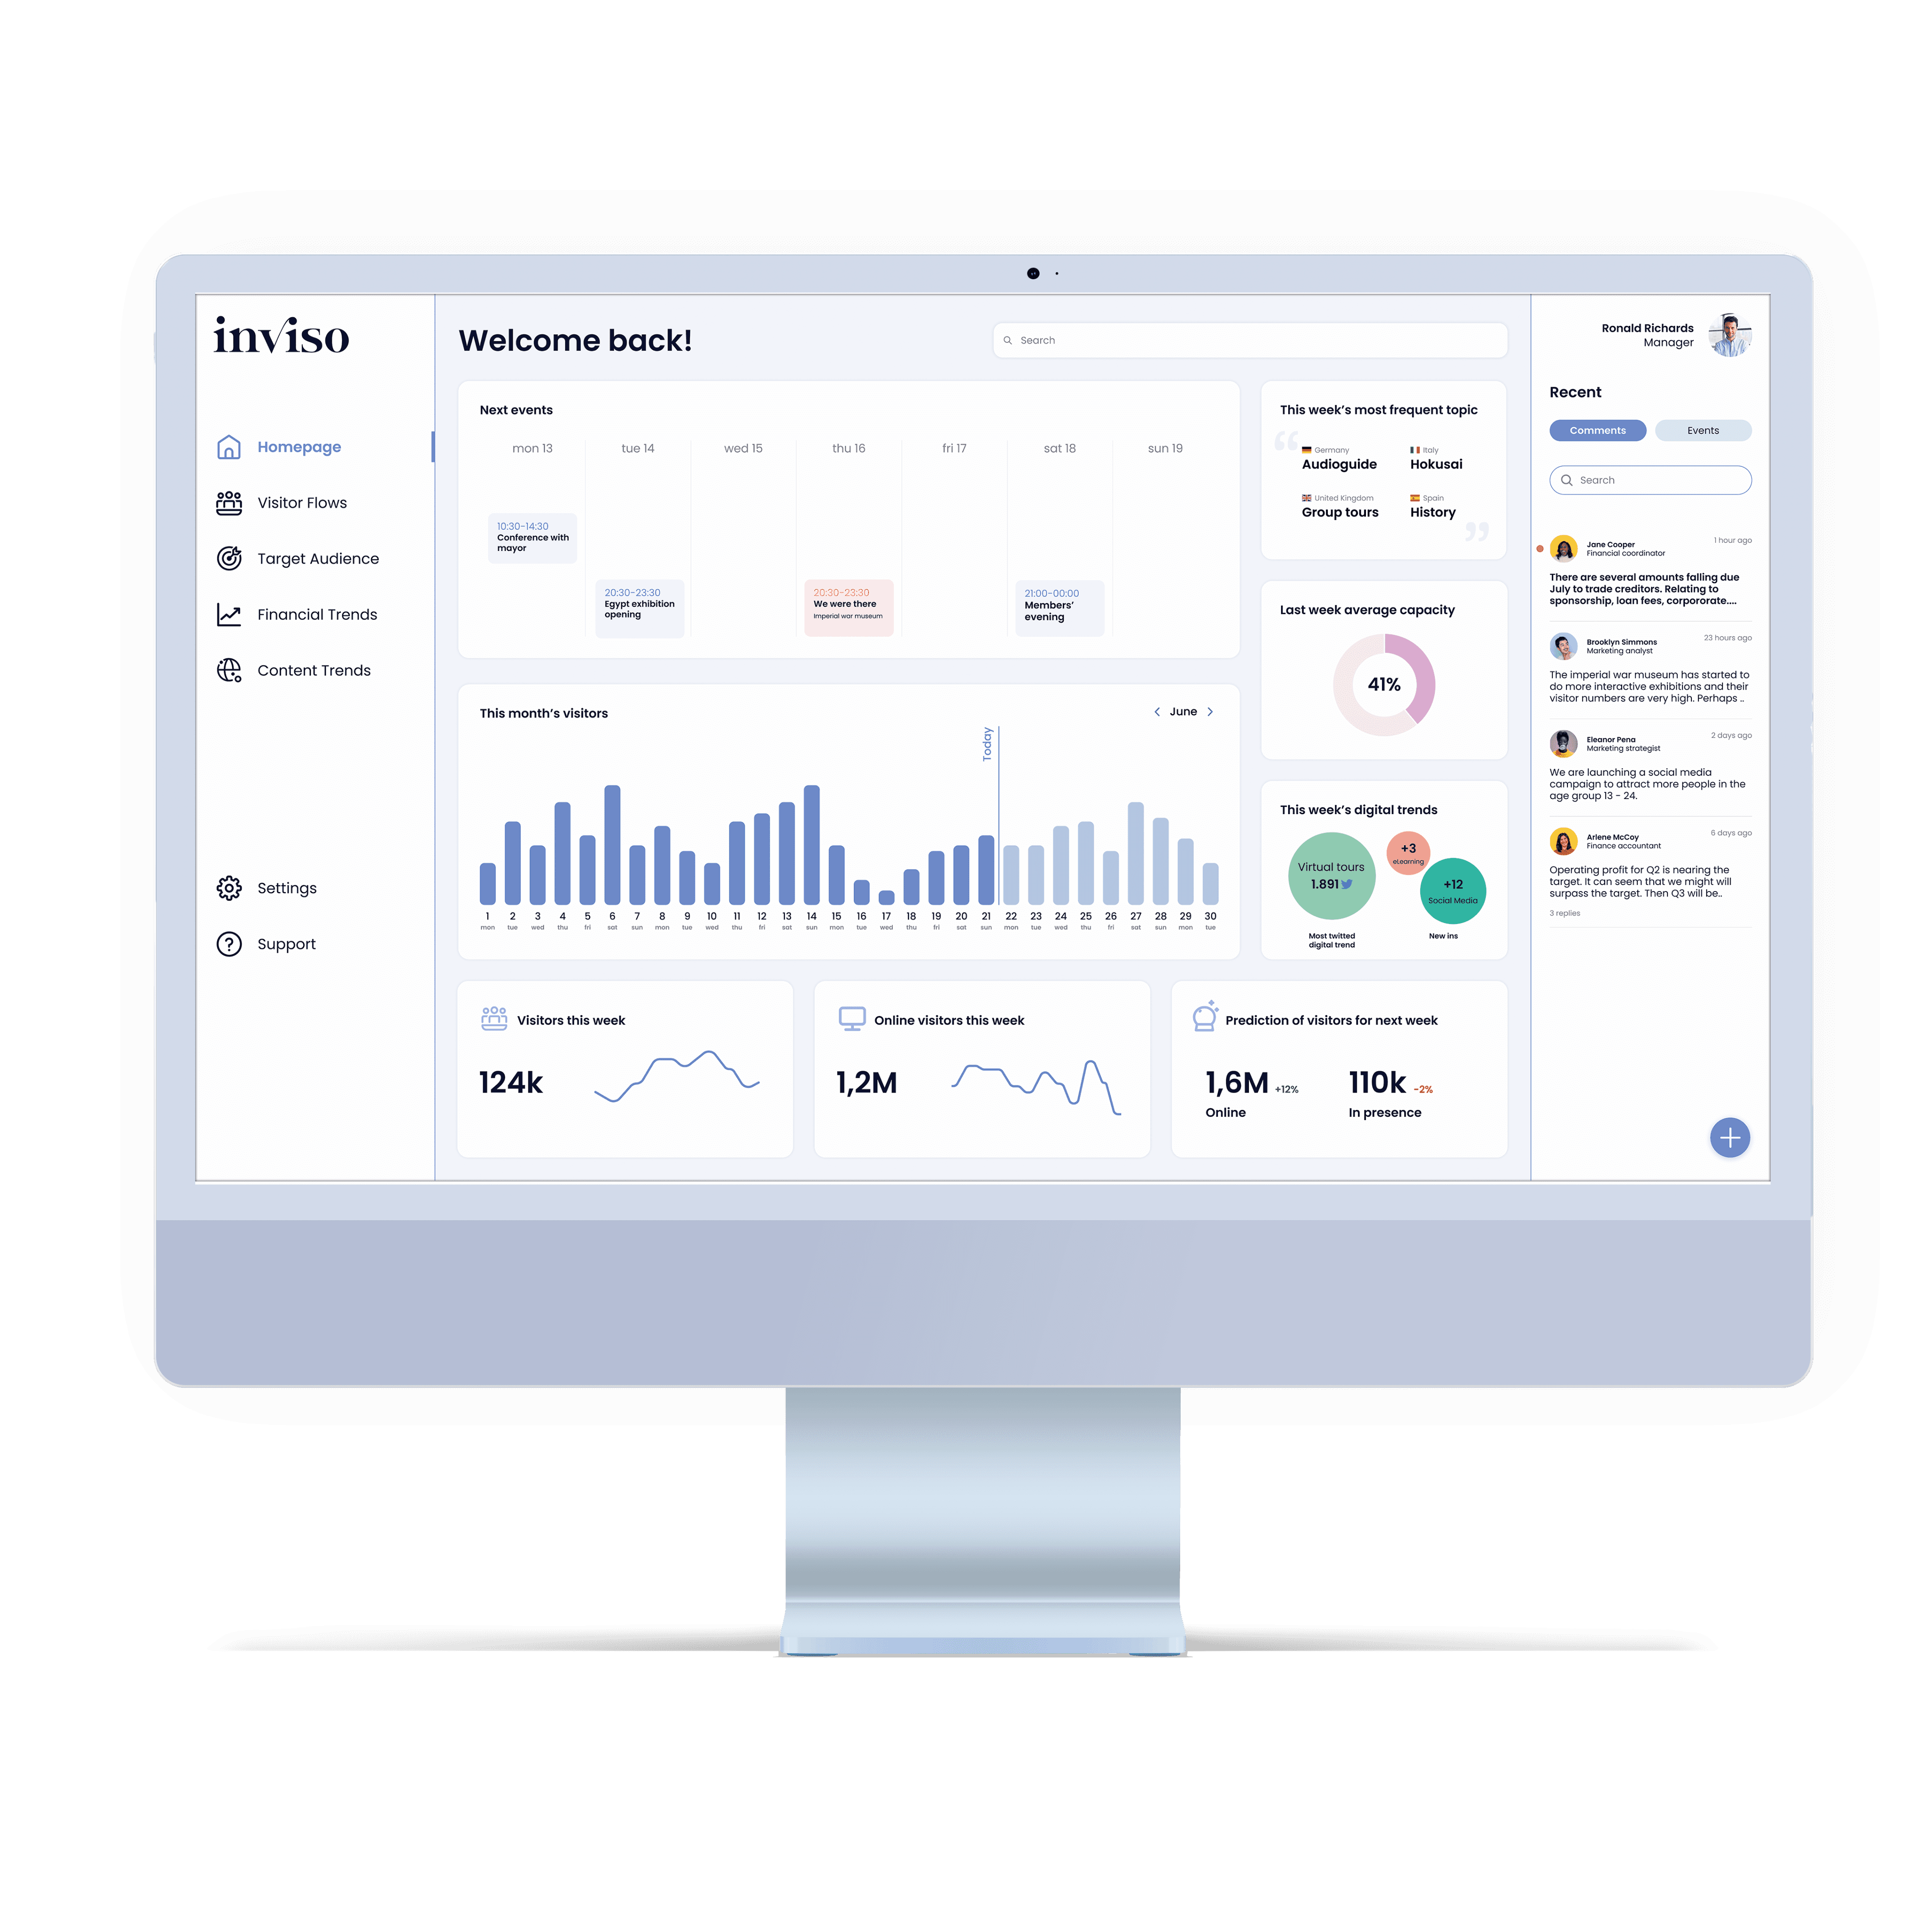
InViso Dashboard
Seamless navigation through AI-enhanced analytics for strategic decisions.
Collaborate effectively with shared insights and unified goals.
Team Synergy
Age
Country
Gender
Trip type
Data-Driven Strategy
Transform complex data into insights, strategic actions and future forecasts.
Database
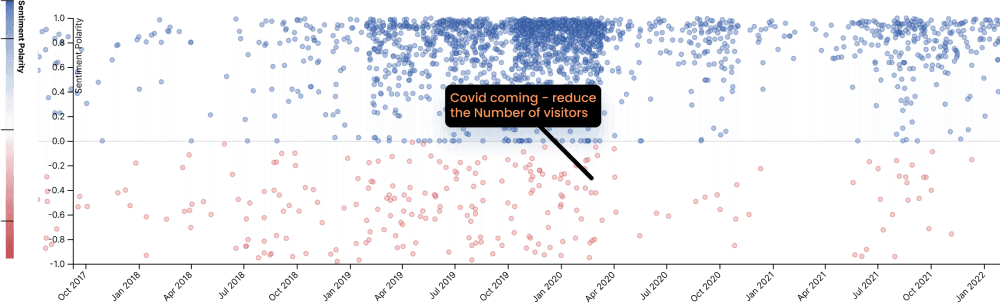
Find frequent positive/negative topics (by gender, age, trip type, nationality)

NLP
Topic
identification
Sentiment
analysis


Extract reviews
TripAdvisor API
Confidence in Post-Pandemic
600K
400K
200K
Visitor number
295 K
May 2022
18 %
from April
Predictive tools for a resilient and adaptive post-pandemic strategy.
Preview of the redesigned app
The British Museum
The British Museum, established in 1759 and recognized as the world's second most-visited museum with an impressive 6.2 million visitors annually. During Pandemic, the museum's forced closure experience brought digital communication with the public under the spotlight. However, even though online and digital activities increased over the pandemic, many museums were, and still are, poorly equipped in the field. By designing a tool that museums can use, powered with AI, the situation can be improved when future pandemics and challenges are approaching.
First we start with the Stakeholders Analysis, starting with the key groups directly impacting and impacted by the British Museum's operations: (Report and Accounts for 2022 The British Museum)
Manager
Marketing team
Financial team
Impacted
stakeholders
Strategic
stakeholders
Developers
Designers
Manager
Artificial Intelligence Engineer
Providers
Financial department
Communication and marketing
department
Curatorial
department
Exhibition designers
Fundraisers
Ticket office
Donors
International and national visitors
Local visitors
Operational
staff
Manager
Ministry of culture
Competitive museums
Newspapers and magazines
Tourist info point
Nearby program (shops, parks, restaurants, attractions)
Schools and unversities
Accomodation
Public transport
Local residents
Researchers
Municipality
Tour guides
TripAdvisor
Social networks
gov.uk
Digital museums
Open data institute
Statista
Customer service
SYSTEM DEVELOPMENT
FUNDING
CONTENT
MANAGEMENT
Stakeholders Analysis
Process
The pink part above is related to our design process, while the green one below is about our work with AI. We want to underline the fact that these two prcesses were carried on in parrallel and influenced one another.
test
analyze
apply
prototype
UI development
blueprint
user journey
offering map
AI promise
& service idea
problem reframing
analysis of stakeholder’s needs and values
user needs
service
content
user stories
possibilities of AI
AI system core
System Flow development
Stakeholders map
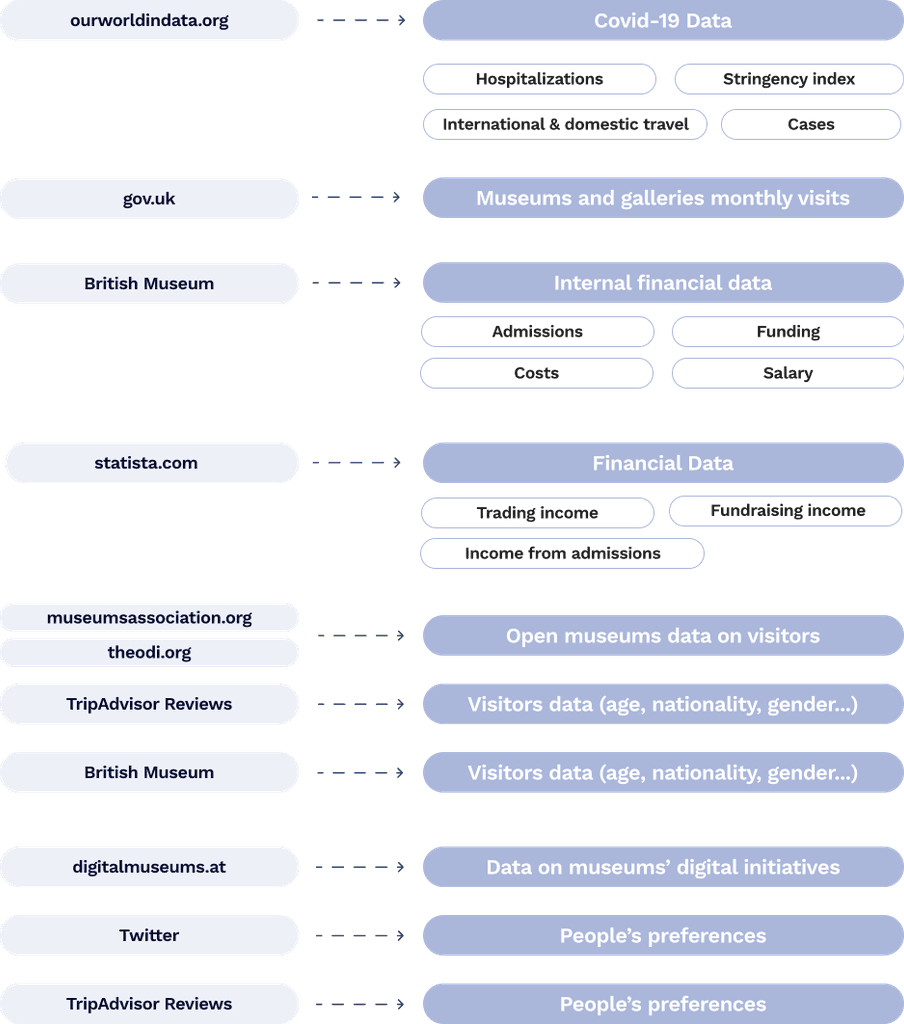
Identifying existing
data sources
Design&AI Process
Through direct research and discussions with the British Museum staff, we pinpointed and assessed the key needs and values of the museum's main stakeholders to guide our concept development.
Needs
Values
updates on restrictions and Covid situation
awareness of financial situation
exposure
(advertise right target groups)
develop the program
education
(teach and inspire)
accessibility and inclusivity
history and culture preservation
engagement
Marketing team
Financial team
needs&Values
After defining the needs and values of the manager of the British Museum, alongside the marketing team and financial department, we gained a deeper understanding and insight of the stakeholders. From this, we could conclude that the underlying problem we needed to solve with the concept was:
Problem Framing
"How do we help museum managers predict the number of visitors to ensure that correct safety measures can be prepared and communicated. How do we help them predict which visitor segment to target which ads at, concerning age groups, gender and nationality."
Problem Reframing
"The targeting strategy is not too focused, and the attraction's content delivery is static and not easily adaptable. This impacts the revenues and the ability of the attraction to provide value after pandemic."
Data and Algorithm
Implementing Artificial Intelligence in the concept, we needed to gather data sets supporting AI technology. These data sets needed to be carefully analysed and retrieved to develop a meaningful and helpful dashboard.
Model plotting
It was essential to know if and how we could use the data with Artificial Intelligence and Machine Learning to solve the problem stated and meet the users' needs. Therefore, four major promises of what Artificial Intelligence and Machine Learning could provide the system were defined and each of their benefits.
Objective
Inputs (data sets)
ML/AI Task
Outputs
Business Value
How many people will be likely
to come in the
near future?
Museums & Galleries
monthly visits
Covid-19 Data
N visitors this month
(% less/more than last)
Information used to plan and organise museum’s activities
bayesian
network
clustering
Who is the museum’s
target audience?
Open museum’s data on visitors
British Museum’s visitor data
TripAdvisor Reviews
visitor data
Covid-19 Data
Clusters of target visitors
(based on age,
gender, nationality,
Covid restrictions...)
More efficient user targeting and content delivery
Objective
Inputs (data sets)
ML/AI Task
Outputs
Business Value
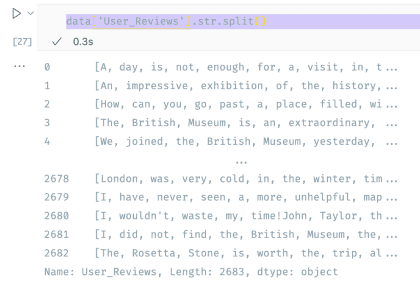
NLP
topic identification
sentiment analysis
What is the museum’s
financial situation?
Internal
financial data
Financial data
Covid-19 Data
Profit or loss of profit
Information used
to take proactive actions to earn/save money and prevent financial damage
Objective
Inputs (data sets)
ML/AI Task
Outputs
Business Value
bayesian
network
How should content
be delivered to the target audience?
classification
Data on museums’ digital initiatives
Data Scraping
Trends in types
of content and audience preferences
Awareness on current trends
to inspire content delivery and
attract visitors
Objective
Inputs (data sets)
ML/AI Task
Outputs
Business Value
NLP
sentiment analysis
Design&AI Process
Service
Offering Map
From the AI promise we developed also an offering map focusing on each of our stakeholders.
Stakeholder
Activities
Service and Platform
Knowledge Outputs
British Museum’s Manager
Staff Management
Decisions on type of exhibition
Opening / closing of the museum
BM’s Financial Department
BM’s Marketing Team
Ask for donations
Invest or save
Staff management
Advertise to most likely visitors
Customized marketing strategy
Suggest content delivery
Prediction on amount of visitors
Interactable online dashboard
Personal app for tablet
Interactive totem for meetings
Interactable online dashboard
Personal app for tablet
Interactable online dashboard
Personal app for tablet
Museum’s financial trend
Likely visitors & digital audience

User journey
Museum staff (manager/financial advisor/marketing advisor) accesses the dashboard after receiving notification of unexpected shifts in numbers. With our dashboard, the user aims to understand the situation to make an educated decision, whilst the service seeks to clearly communicate current, past and possible future statuses to the user.
Action
Phases
Touchpoint
Opportunity
Receive notification
Sign into personalised dashboard
Access page: Visitors flow, target, finance, content
Develop application for phone/tablet for
easier access
Personal sorting of widgets
Comparison between different time periods
Export frames
Include direct access to email
See actual effects of decision
Inspect single widget
Operate widget: add filters, comparison
Get description of data
Report findings to relevant stakeholders
Discuss and make decision
Input decision in system
Track decision
Access and browse
Inspect and operate
Discuss
Inform
Connected tool
Connected tool
Digital dashboard
Specialised info shown first
Content
pre-sorted
Clear division
Focus data
Descriptive help to understand
Multiple ways to share info
Common ground
Connect decision to specific moment in time
See trend after decision
Correct filtration
Data ambiguity
Correct input of decision
Unable to know exact effect of decision
Understanding variables affecting situation
Receive notification
Service Blueprint
The blueprint aims to represent the service over time, with the same scenario as in the user journey. It’s limited to the service’s technological assistance. However, it could also include installation and introduction to the system. The chronological representation of the user experience, including the organisational processes, helps to understand where the service provides what and which backstage actions we must include for the system to perform.
LINE OF INTERNAL INTERACTIONS
Backstage actions
Front-stage actions
User journey
Channel for interaction
Online evidence
Time
10 sec
10 sec
> 1 min
Support processes
LINE OF INTERACTION
LINE OF VISIBILITY
> 20 min
> 1 hour
30 sec
TripAdvisor API
Database
Server
Analytics log
Notify relevant users
Specialize view for user
Twitter data scraping
Natural language processing
Sample potential problems
Data clustering
Data description
Prediction and comparison
Saves comments
Captures situation and saves decision to it
Notes following results to decision
Expand view field
Change visible information according to user actions
Provide main descriptions/details of selected data
Commenting function
Show relevant content
Assistance from Inviso employee
Notifies on dashboars, pop-up, email
Sign in
Receive notification
Sign into personal dashboard
Receive assistance from system
Access page: Visitors flow, target, finance, content
Inspect single widget
Operate widget: add filters, comparison
Get description of data
Report findings to stakeholder
Discuss and make decision
Input decision in system
Track decision
Internal/external notification
Sign in portal, personal information
Help page
Visitor trend, target user, financial trend
Enlarged information
Toggles, drop down menu, button
Overlay
Commenting field
Input field
Connected tool
Digital dashboard
Board totem
Digital dashboard
Prototyping
Agile mode was adopted by focusing on each section of the dashboard one by one and the team developed the element through quick ideation sprints. This helped in finishing the interface design for all the user groups.
Personalised Homepage
When creating this section, we addressed the Manager's need to have an overview of the most relevant information, to assess the museum's general situation and allocate attention accordingly.
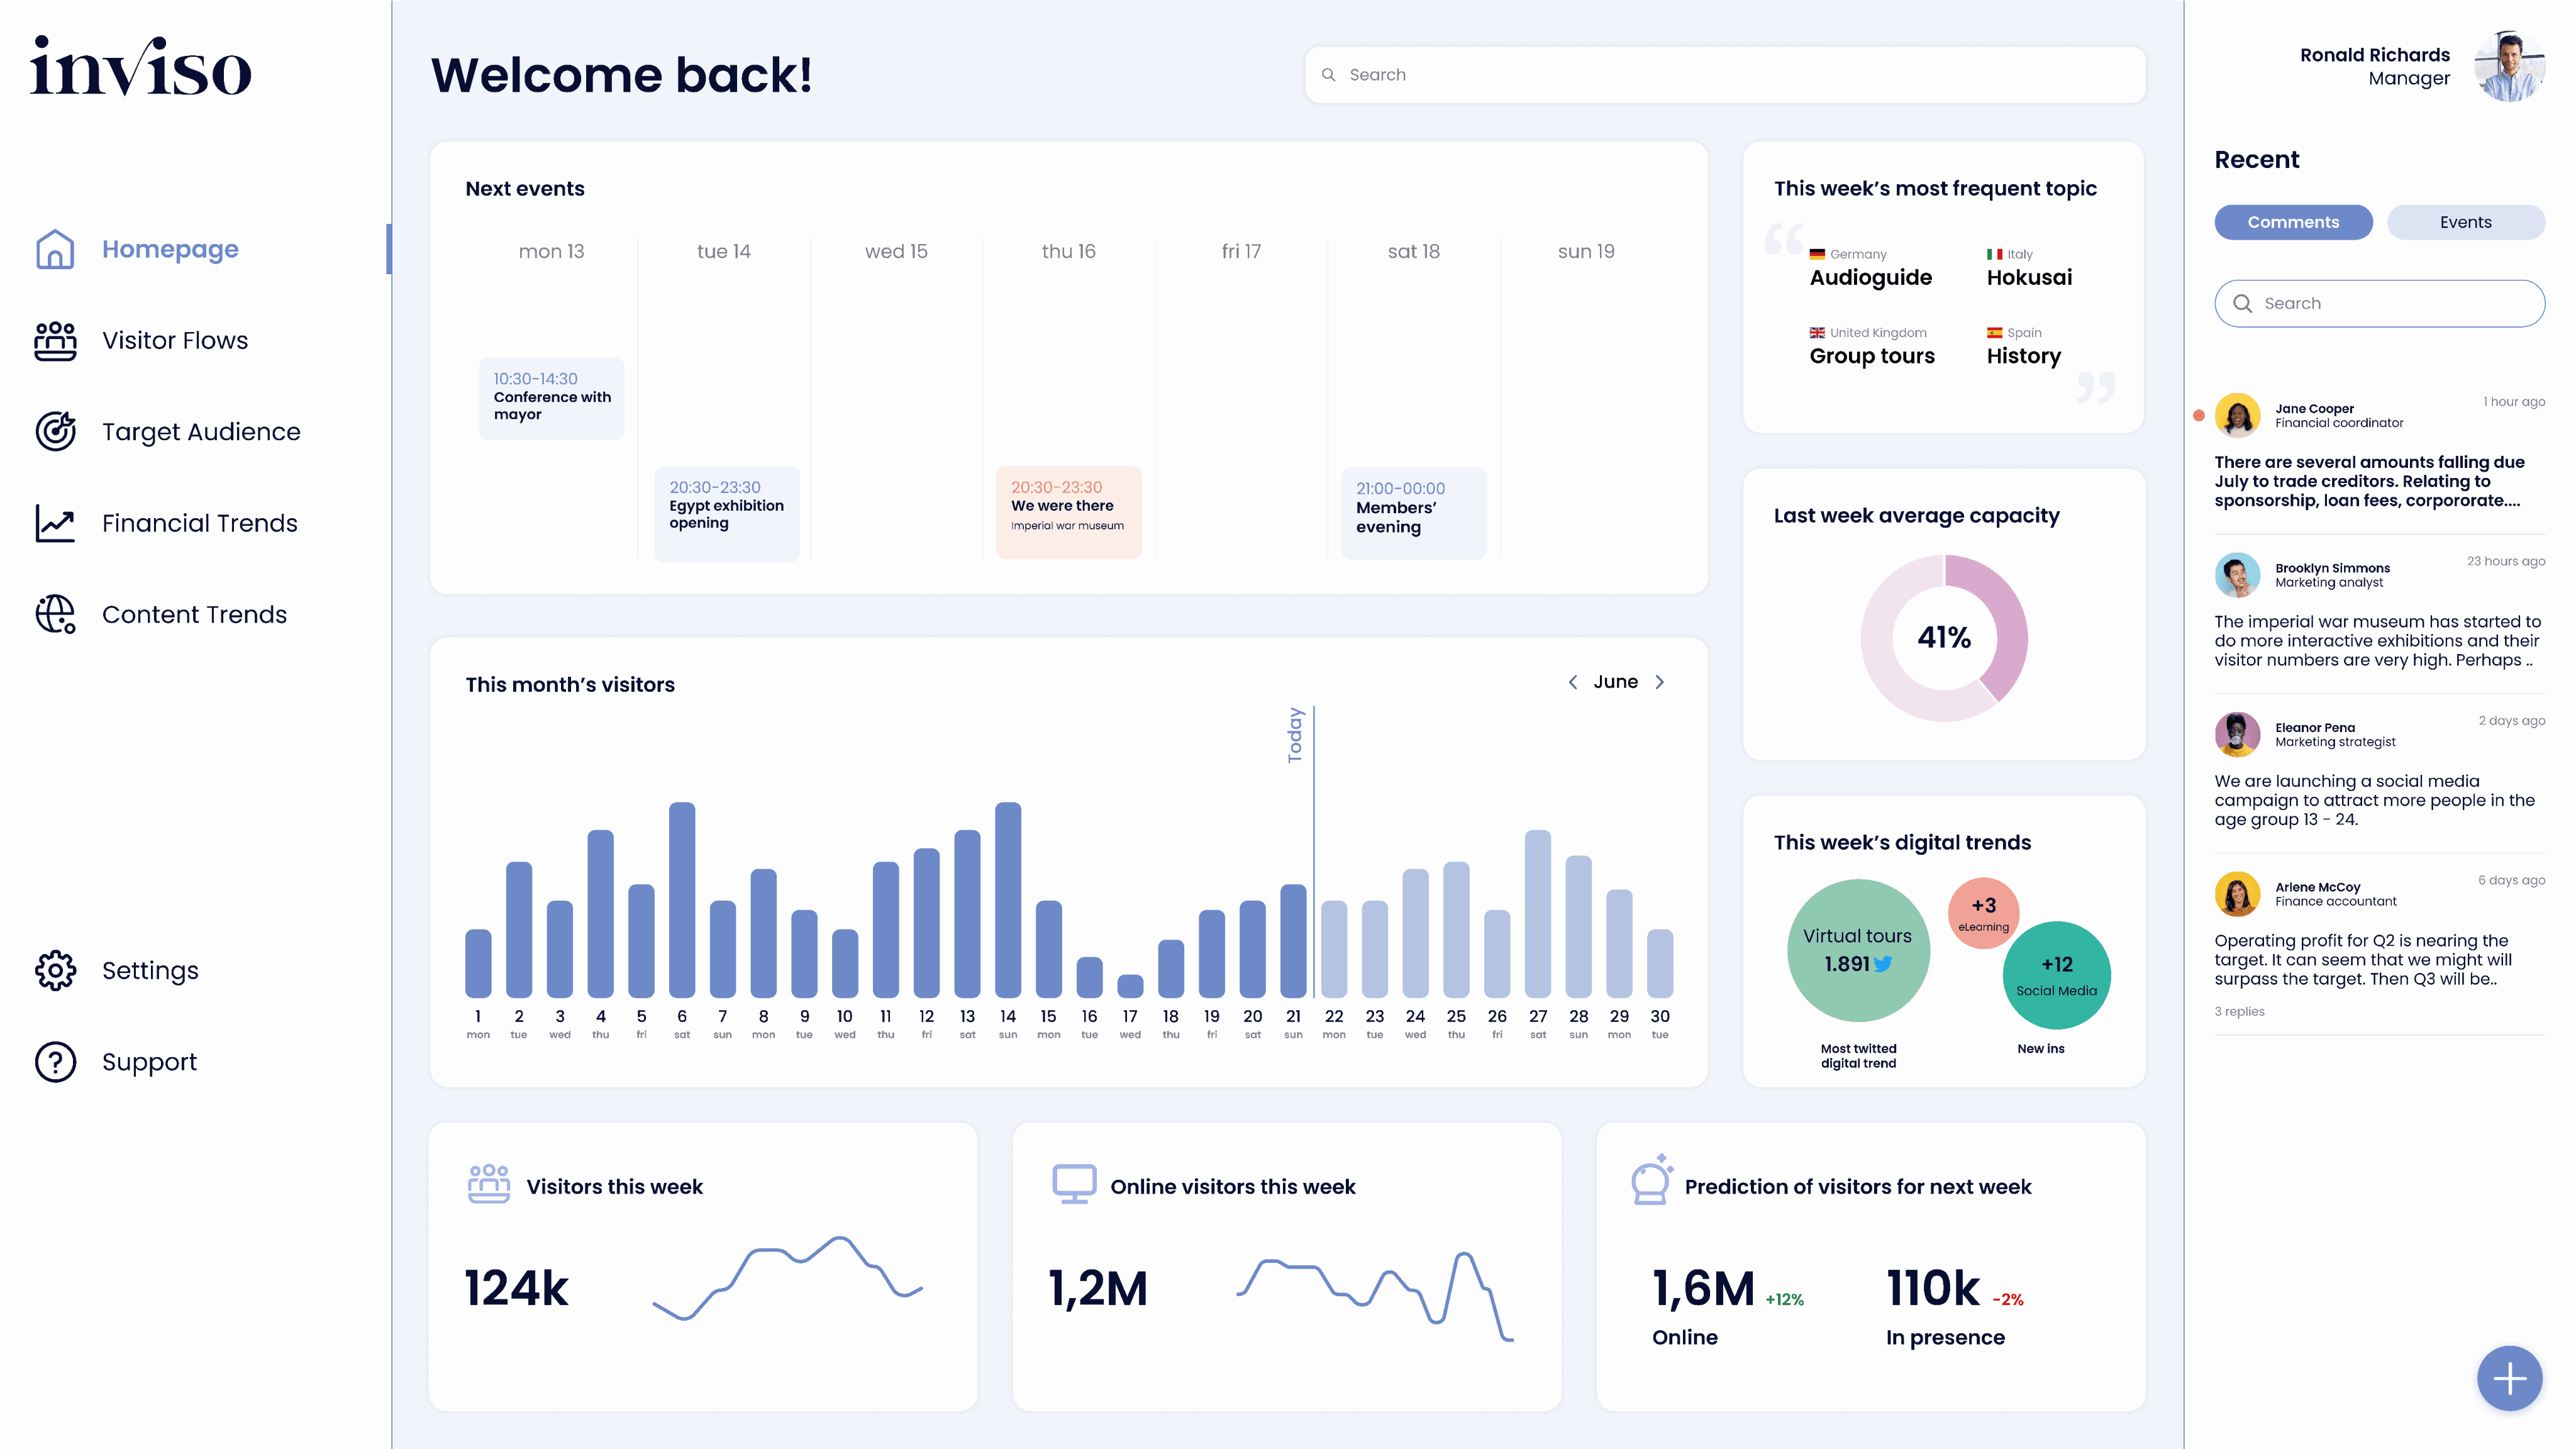
Visitor Flow
An overview of the British Museum’s past performance in terms of visitor numbers, with a monthly subdivision paired with a prediction of how many people will likely visit the museum in the near future.
Target Audience
An overview of the British Museum’s target audience. The distribution can be observed based on different parameters, such as age, gender, nationality and trip type. The users can decide to activate the visualisation of Covid restrictions to understand their impact on the museum’s target audience.
Financial Trends
An overview of the past financial performance of the British Museum in the selected time frame, as well as a prediction of the expected financial performance in the future.
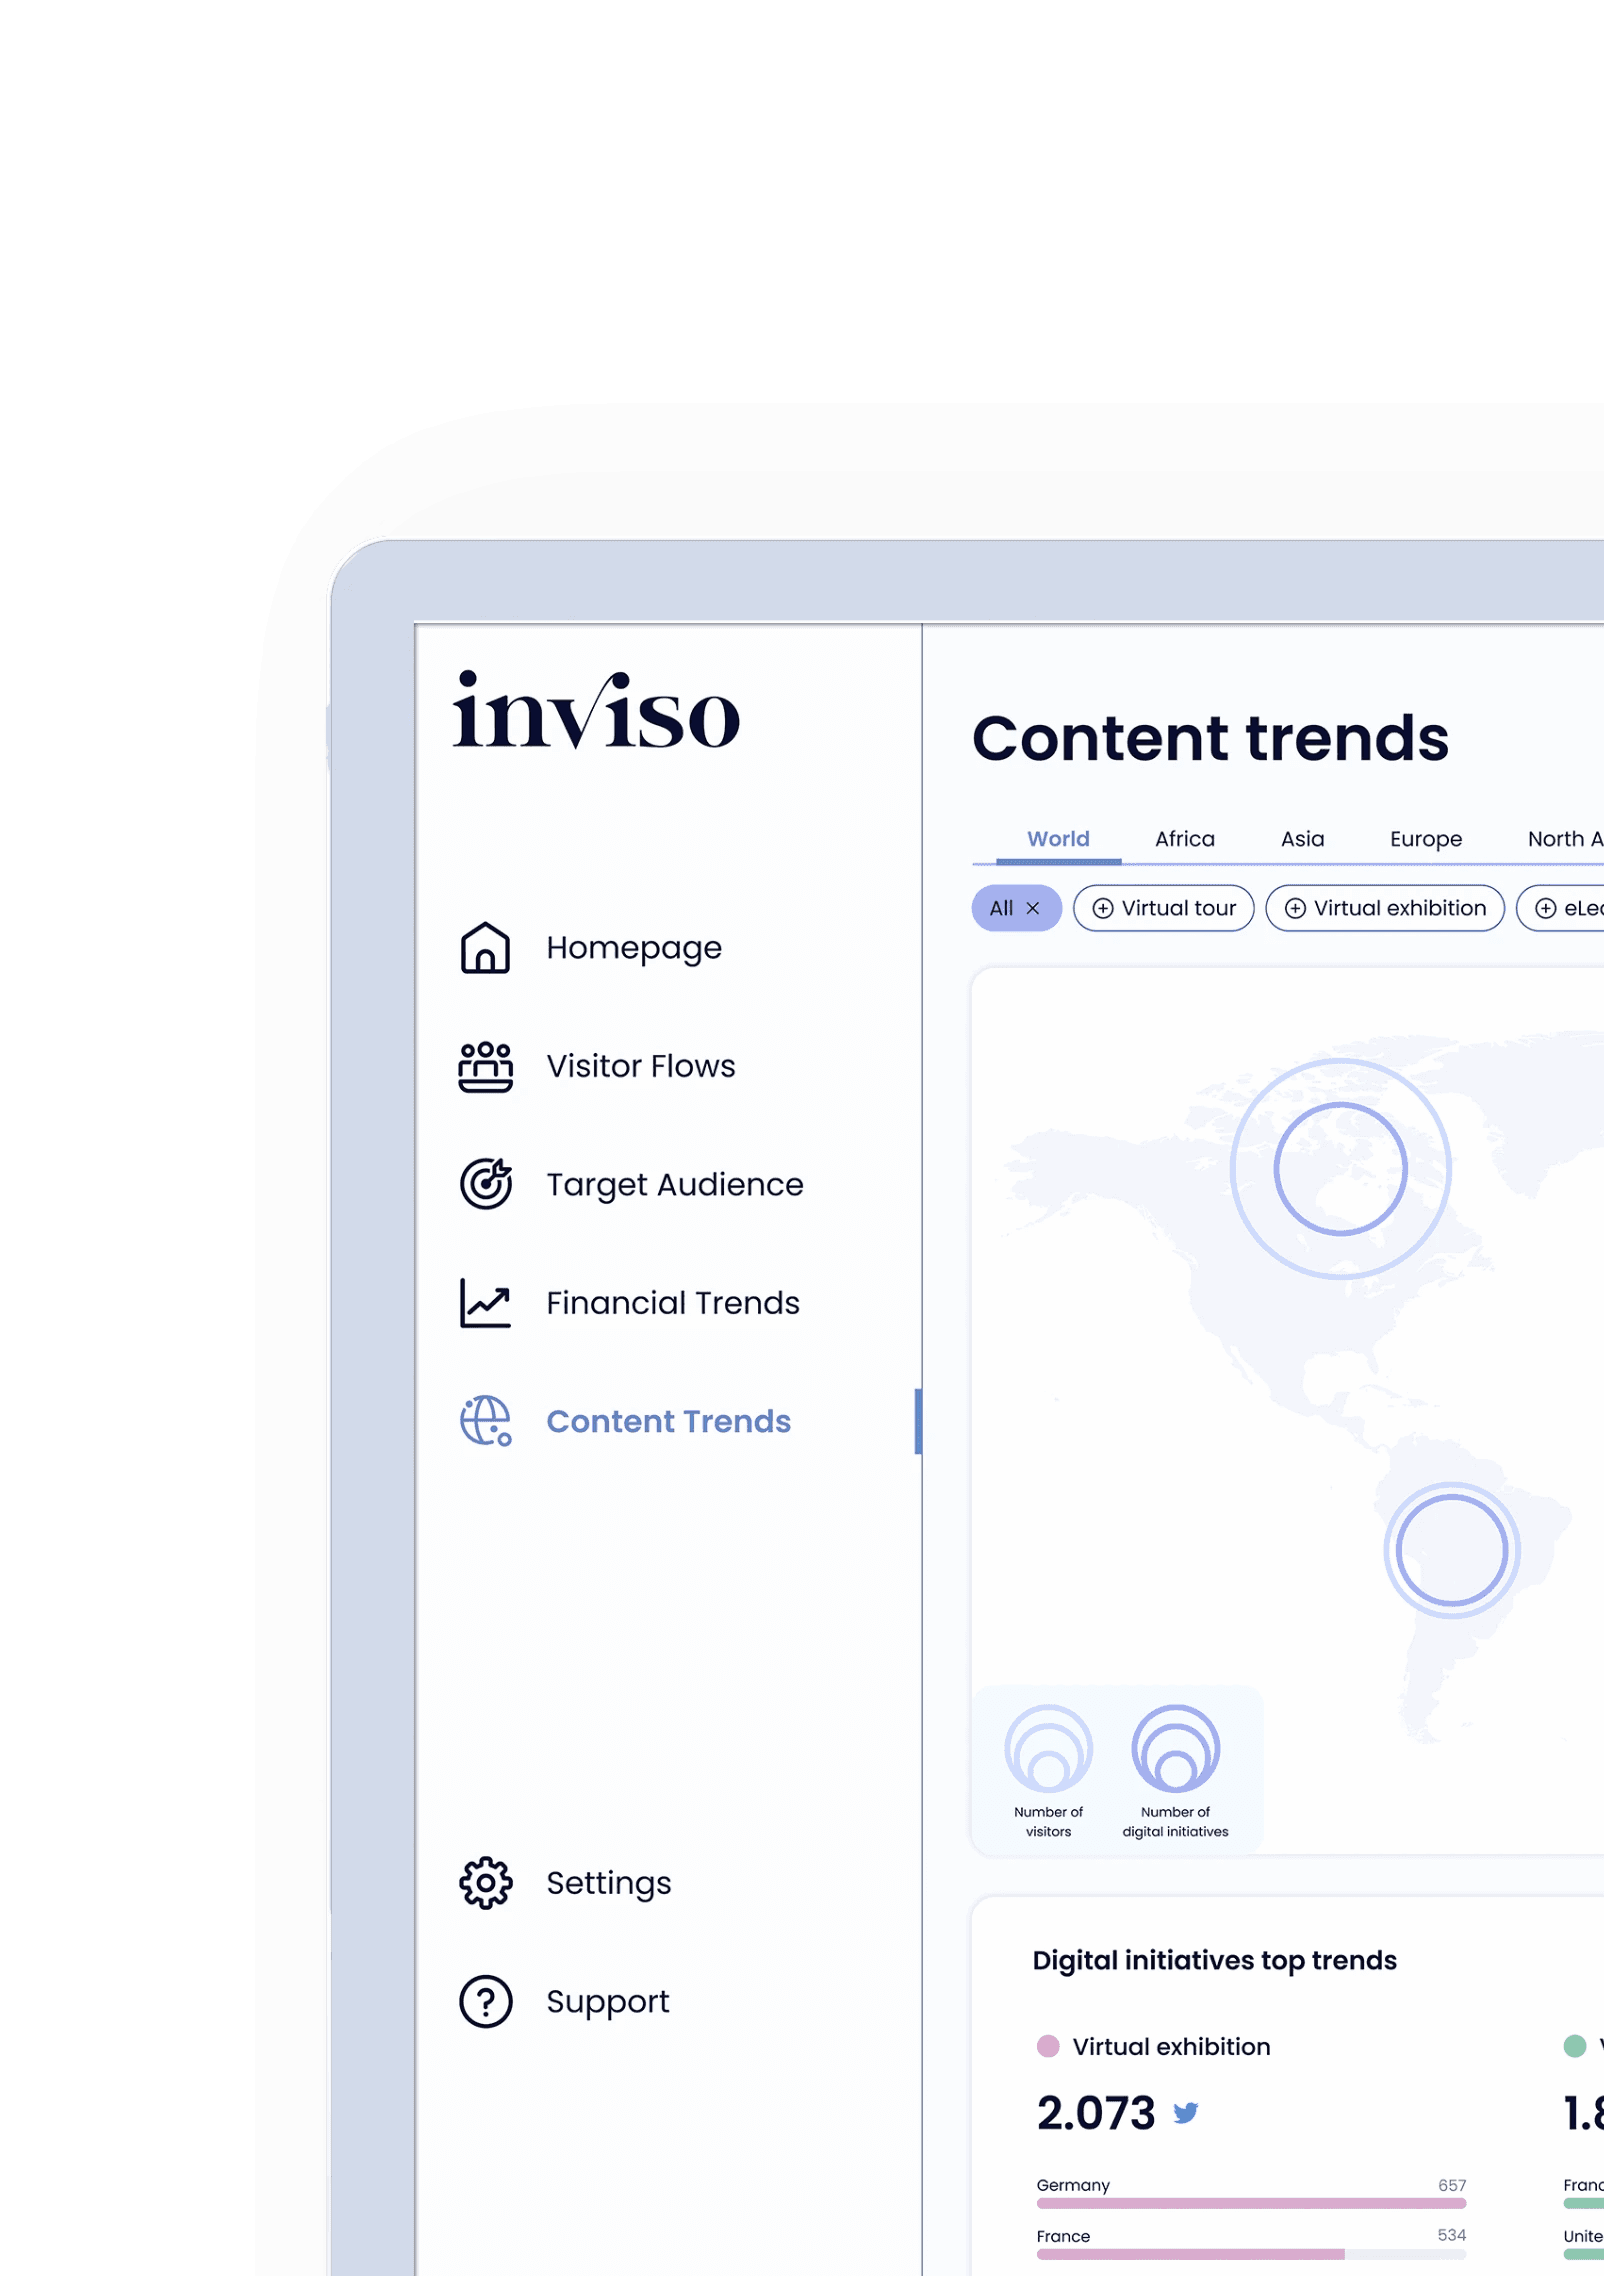
Content Trends
An overview of other museums' digital initiatives. Displaying information about which digital initiatives are more popular, and a more detailed list with additional info and links to the digital initiative's related website. Establish the top 3 trending digital initiatives for the selected timeframe.
Check the Intereactive Prototype
Check the Intereactive Prototype
Service
Project Report
Please feel free to download the report if you're interested in a detailed overview of the overall process, including algorithms, services, and concepts.
Download Report
Download Report